First, measurement. To get past regulatory horror stories, just how do we measure the problem? They use the Mercatus Center's new RegData database, which is based on textual analysis of the Federal Register.
Second, functional form. How should we relate regulations to output? Here they use a detailed industry growth model. You may object, as to any model, but at least the mechanisms are explicit and you can choose different ones if you want. (I haven't plowed through all the equations, and am interested to hear comments from those of you who have.)
Third, estimation. They use the variation in industry outcomes related to differential regulation of those industries to estimate the effects of regulation on investment.
The bottom line is pretty startling:
Economic growth in the United States has, on average, been slowed by 0.8 percent per year since 1980 owing to the cumulative effects of regulation:A graphical summary:
If regulation had been held constant at levels observed in 1980, the US economy would have been about 25 percent larger than it actually was as of 2012.
This means that in 2012, the economy was $4 trillion smaller than it would have been in the absence of regulatory growth since 1980. This amounts to a loss of approximately $13,000 per capita,...
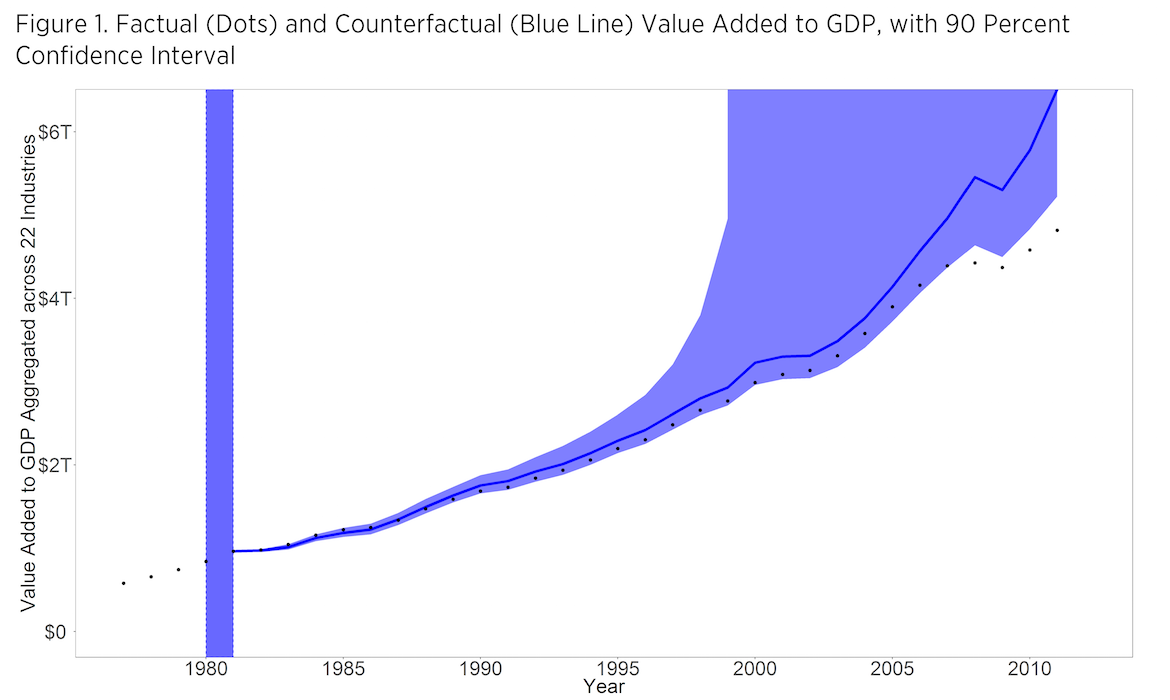
(It's interesting that the standard errors are so weighted to the up side. I checked with the authors, this is indeed how the distributions of uncertainty work out in their estimation.)
I also found this nice graph from Chad Jones,

Chad's graph differs from mine for a few reasons. First, his index of "social infrastructure" from the world bank is more comprehensive, including Accountability of politicians, Political stability, Government effectiveness, Regulatory quality, Rule of law, Control of corruption. Second, he has total factor productivity on the Y axis. The vertical axis is a log scale, so read carefully. 1.6 (Singapore) is a lot more than 1.0, though they are compressed on the graph.
Không có nhận xét nào:
Đăng nhận xét